
I’ve worked in or around SOCs my entire career, from analyst to director. In every role I held, I was either measured by metrics or responsible for producing them. Yet it always felt like those metrics gave no valuable insights into how our SOCs actually operated.
In my hands-on-keyboard years, I would collect metrics and send them over because it was expected of me. After moving to leadership roles, I finally had the agency to reassess our approach to SOC metrics and decide which are worth collecting.
Long story short, here’s my current take on measuring SOC effectiveness:
The problem with SOC metrics
My biggest issue is that metrics seem to incentivize the wrong things. If you optimize for speed or volume, you’re essentially encouraging surface level investigations. On one hand, we say we want quality investigations done by our analysts. On the other hand, we judge them by how fast they handle alerts or how many they can fit into their shift.
Another issue I have is that SOC metrics very often require a ton of context to actually mean anything. Context that leadership has no interest in, or technical ability to understand.
Let me explain: SOC metrics commonly measure:
- alert volume
- time to start working on an alert (often called Mean Time To Acknowledge)
- time to close an alert (typically Mean Time To Resolve or Close)
- time to detect (Mean Time To Detect)
- detection coverage
- escalation rate
and many more, often just variations of these. I take issue with most of them.
Take alert volume. If I see high numbers, what does that actually tell me? Are we unable to tune our environment properly? Or is this just the reality of our workload? And if it’s low? Does that mean we’ve written incredibly effective detection rules, or are we missing detections?
MTTA and MTTR are equally tricky. While it makes sense to ensure alerts get resolved in a timely manner, emphasizing speed often leads to surface level investigations with no room for in-depth work. I’ve seen multiple MSSP contracts where MTTA and MTTR for high severity alerts were both set at 15 minutes. That’s 30 minutes total to handle a high severity alert end to end. That’s not realistic under any circumstances.
I’ve also seen SOCs measure MTTD religiously, but this always felt like an incident response metric to me, meant to estimate how long a threat actor was active in our environment prior to detection. Otherwise, what are we even measuring? How well our tools work? I guess. But if the time between an event taking place and our security tools detecting it is long, what can we realistically do about it? In SIEMs we can maybe account for ingestion delay / have detection run most frequently etc., but if the EDR is late to detect something? Our hands are mostly tied.
Finally, what even is detection coverage? I’ve seen SOCs measure it by data sources or MITRE techniques. But when do you consider either of them “covered”? Is one detection rule enough or do you need more? Can you realistically cover everything a data source or a MITRE technique has to offer and do so on every system? Plus, MITRE is pretty endpoint heavy, and EDRs don’t advertise their exact detection capabilities. Hell, these days some vendors even refuse to participate in MITRE evaluations of their tools. So how are you supposed to measure coverage when you don’t even know what your tools are detecting?
I could go on and on, but let me mention just one more thing. All these metrics are incredibly easy to game. I’ve worked at and with MSSPs for a long time, and I’ve seen every tactic in the book for skewing SOC metrics to appear compliant in monthly reports. I write about this in detail here:
Traditional SOC metrics either fail to provide insights into the actual state of security operations, or require a ton of context and understanding that, in my experience, leadership doesn’t have and isn’t interested in gaining. In other words, those metrics are either meaningless or very complex. I think we can do better.
What to do instead?
Establish Quality Assurance first.
This means that once a week, bi-weekly, or monthly, one of your best analysts samples alerts handled by the team to verify they were done correctly. This article isn’t about QA specifically, but here are some approaches you can consider:
- QA only high severity alerts (probably a good starting point)
- Sample X alerts per analyst (to spot quality issues with individual team members)
- Sample alerts completely at random
- Sample alerts with the highest MTTR or specific resolution comments
- Query for easily spotted issues like missing resolution comments, wrong tags, or unassigned alerts
Without QA, your metrics are useless. What good is MTTA/MTTR in the green if alerts aren’t resolved correctly? What does the false positive rate matter when alerts are categorized incorrectly? And so on.
After you’ve established QA, here are some metrics I think are a decent way to measure your SOC’s effectiveness
Alert volume per analyst (optionally compared with % of alerts that failed QA).
Without any context about an analyst, such as their skills, work ethic, tools, or shift length, I’d say they can handle about 20 alerts per day. T1 analysts can probably do closer to 30, T3 closer to 10, but overall the daily average should land around 20 alerts per analyst.
20 is fine, 30 is probably manageable, 40 might be stretching it. If you commit to 20-40 alerts per day per analyst as a target, I think you’ll end up running a healthy SOC.
Now, if you want to make this metric better, compare it against the percentage of alerts with quality issues. Obviously, this isn’t perfect because you can’t QA all your alerts, but it’s still a useful data point.
There’s a breaking point where your analysts will start missing alerts entirely due to high workload. But before that point, there’s a whole range of alert volume that won’t cause analysts to miss alerts, but will impact investigation quality. That’s the danger zone you’re trying to avoid and want to be aware of.
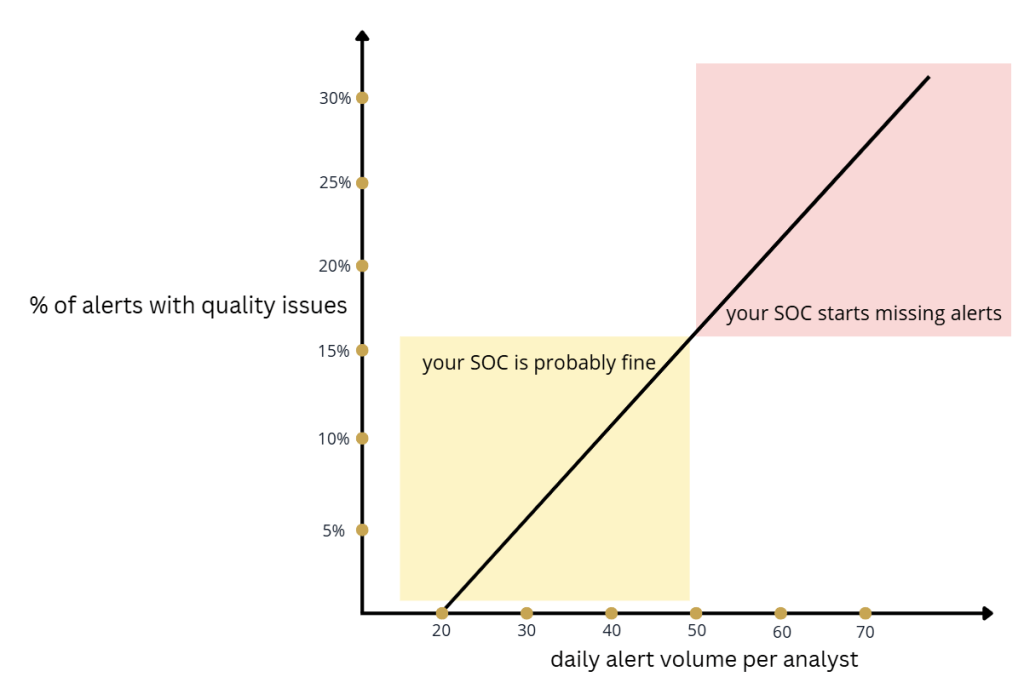
This metric helps you identify what alert volume your SOC can actually handle. In other words, by comparing alert volume to the percentage of alerts that didn’t pass QA, you can estimate a rough workload ceiling for your team and manage your team’s workload accordingly.
% of high severity alerts that failed QA
While you can’t do QA on all alerts, you should aim to cover a reasonable sample of high severity ones. Failing QA on low and medium severity alerts usually means SOPs either aren’t being followed or need to be rewritten more clearly.
But with high severity alerts, analysts rely more on their own judgment rather than following SOPs to the letter. This is why it’s critical to identify high severity alerts that were resolved incorrectly and address them with the team, so everyone understands what went wrong and what needs to be done in similar scenarios.
True positive rate
Or the percentage of alerts categorized as True Positive in a month. This is essentially the False Positive rate, but reversed. I find it easier to discuss True Positives because SOCs have a common understanding of what a True Positive actually is. There are now categories like Benign Positive that dilute False Positive rates, and all that results in is a more vague metric.
True positive rate is simple to calculate:
True Positive Rate = (True Positives / Total Alerts) × 100
In my experience, a healthy TP rate is anywhere between 0.5% and 5%. A TP rate over 5% isn’t necessarily bad for your SOC, but it points to issues with your security posture that should be addressed.
Benign positive rate
Or the percentage of alerts categorized as Benign Positive in a month. Not all tools support this metric, but for those that do, I think it’s valuable to track. Here’s how you calculate it:
Benign Positive Rate = (Benign Positives / Total Alerts) × 100
Benign Positive tells me this: “I had to investigate, but it turned out to be benign activity.” The “I had to investigate” part is what differentiates it from False Positives. It essentially tells me what percentage of all alerts generated in a month required actual investigation.
I’ll be real, it has to be over 30%. Otherwise, your SIEM needs work.
SIEM cost efficiency
This is the one I care about – mostly because I’m Polish, partly because this is an increasingly important component of security operations. You could argue that security budgets are not necessarily growing at the same rate as the attack landscape of an average organization. This requires a smarter approach to cost efficiency of security operations.
Some of the things I like to keep in mind when measuring SIEM cost efficiency:
- Cost per data source
- Detections per data source
- Alerts per data source
- Percentage of overall cost per data source
My bare minimum definition of cost efficiency is this:
- Have at least one detection rule per data source
- Have at least one alert per month per data source
- Keep the cost per alert below $500
There are two caveats. First, I’m only calculating cost efficiency for data kept in hot storage. Anything stored in cold storage, archive, storage accounts, data lakes, etc. is not included. Second, this doesn’t apply to critical assets.
Let me explain with a scenario:
Your SIEM budget is $20,000 per month. You’re collecting $5,000 worth of firewall logs, you have 5 detection rules that use those logs, and you generated 2 firewall related alerts this month. Firewalls are not your critical assets. This means that:
- Firewall logs are 25% of your total SIEM cost
- You’re paying $1,000 per detection rule
- You’re paying $2,500 per alert
Is this cost effective? I would argue it’s not.
Now, if firewall logs make up 25% of all your SIEM costs and the remaining data is collected in a cost effective way, then your overall cost efficiency is at 75%
Automation rate
The percentage of alerts closed by automation. Optionally, add the percentage of alerts automatically enriched with additional context and divide by 2. So, two options here:
Automation Rate = (Alerts Closed By Automation / Total Alerts) × 100
or
Automation Rate = [((Alerts Closed By Automation / Total Alerts) × 100) + ((Alerts Enriched By Automation / Total Alerts) × 100)] / 2
I think this metric is nice to track internally, and I’ve found it lands very well with leadership. The only major caveat lies in the definition of automation. Auto-closed alerts are not the same as alerts closed by automation. You can have a rule that closes all DLP alerts and call it automation. I believe that at a minimum, your automation needs to have more logic than:
if alert.title == "XYZ":
alert.status = "closed"
I understand automation as logic that has at least 2 steps and ideally relies on a threat intelligence source and / or additional organization specific context. If done correctly, this metric helps you understand how effective your team is at automating away noisy alerts, not just by tuning, but by automating actual investigation steps.
SLA compliance for high severity alerts
As I already mentioned in this article, it makes sense to ensure high severity alerts are handled within a specific time frame. However, this only works if the time frame is realistic. I believe that a total time under 1 hour to handle a high severity alert is too short and leads to surface level investigations or analysts closing alerts before the full investigation is actually concluded.
I believe tracking SLA compliance for high severity alerts only works if you give your analysts at least 1.5 to 2 hours total between MTTA and MTTR. Then I like to make sure we’re hitting 90%+ compliance. You can break it down by analyst to understand where potential issues are and address them with those individuals.
Summary
There are metrics I like to track for my own reference, but I don’t obsess over them and don’t use them to demonstrate the effectiveness of SOCs I work with:
- Mean Time To Acknowledge / Mean Time To Resolve for all alerts
- Alert volume before tuning
- Detection coverage
- Mean Time To Detect
- Escalation rate
- False positive rate
- False negative rate (don’t get me started on this one)
There are metrics I kind of like and use from time to time:
- Detection rule performance (alerts generated per rule)
- Percentage of logs in cost effective storage vs hot storage
- Alerts per analyst broken down by severity
- Alert to incident ratio
And there are metrics I really like and use to demonstrate SOC efficiency:
- Percentage of high severity alerts that passed/failed QA
- Alert volume per analyst
- True positive rate
- Benign positive rate
- Automation rate
- SLA compliance (MTTA/MTTR) for high severity alerts
- SIEM cost effectiveness
I’m sure I missed some.
Some people say that security metrics don’t matter at all and what matters is that the business can keep achieving its objectives without third party interruptions. Some say the real metric is the friends we’ve made along the way. I believe metrics can be useful, but you need to be selective with what you track. And most importantly, metrics don’t matter if you don’t have a solid Quality Assurance process in place.
Thank you for reading, if you want to discuss the contents of this artcile with me, find me on LinkedIn:


Leave a comment